The Predictive Power of Options: Implied Volatility and Volume Dynamics Around Corporate Earnings
Phat DiepCarnegie Mellon University in Qatar
Abstract
This study investigates the extent to which pre-earnings announcement options market signals effectively predict stock returns post-announcement. Using a dataset of 38,121,908 options contracts for the 100 most liquid firms listed on the New York Stock Exchange from 2001–2023, we evaluate four option-based indicators: Volume-to-Open-Interest ratio, changes in Put/Call ratio, Implied-Volatility Spread, and Max Pain strike. These features are selected to capture investor sentiment, informed trading activity, and short-term price-pressure dynamics. We found that indicators like volume-to-open-interest and implied-volatility spread one day before the earnings days are correlated with post-announcement, indicating that options incorporate forward-looking information. Utilizing the two most significant features, the Volume-to-Open-Interest ratio and absolute options volume, we develop a machine-learning model based on data from the Q2:2001 to the Q4:2019 and assess its performance during an out-of-sample period from Q1:2020 to Q3:2023. The strategy generates an annualized return of 24.9% while allocating approximately 5% of capital per position, with each trade held for only one day. Ultimately, the results from paired t-tests demonstrate consistent changes in Max Pain levels in proximity to earnings announcements, suggesting short-term equilibrium adjustments within the options markets. Overall, the findings demonstrate that options contain economically meaningful information for predicting earnings-related stock price movements.
Keywords: corporate events, earnings calls, event-driven trading, implied volatility, option pricing, option price dynamics
Introduction
The options market has long intrigued both investors and academics due to the valuable insights it provides about future market expectations. A substantial body of literature demonstrates the informativeness of options data through a range of information-based measures, such as option volume (Ge, Lin, and Pearson, 2016), implied volatility (Donders, Kouwenberg, and Vorst, 2000; Mayhew, 1995; Atilgan, 2014), risk-neutral skewness (Chordia, Lin, and Xiang, 2020), option-to-stock volume ratios (Johnson and So, 2012; Lin and Lu, 2015), and strike-spot structures (Bernile, Gao, and Hu, 2017). Collectively, these studies raise a central question: To what degree do option traders integrate private or anticipatory information about major corporate disclosures such as earnings announcements?
Earnings announcements provide an ideal setting for studying informational dynamics in the options market, because scheduled disclosures create a timed window for information dissemination. Kim and Verrecchia (1994) show that when investors possess information about the timing of a public disclosure, trading behavior changes systematically: while informed traders strategically increase their positions before the announcement, uninformed traders reduce participation. This pre-announcement window, characterized by heightened information asymmetry, creates an incentive for informed investors to trade. Chae (2005) similarly finds that cumulative trading volume declines by approximately 15 percent prior to scheduled announcements as uninformed traders temporarily withdraw from the market. As a result, pre-earnings signals can be used to detect whether options markets capture asymmetric information and forecast earnings-related price reactions.
According to recent studies, the way information is incorporated into prices is determined by the structure and volume of option trading activity rather than the mere existence of listed options. Truong and Corrado (2014) present evidence indicating that firms with elevated pre-announcement option volume exhibit significant anticipatory price adjustments, implying that options activity incorporates information regarding forthcoming earnings results. The volume of options trading, along with related market attributes, directly reflects the informational environment surrounding pre-announced corporate events.
Despite this extensive literature, the predictive value of within-options signals—those derived purely from the internal structure and behavior of option chains—remains underexplored. Previous research generally analyzes single indicators (such as skew, volume, or volatility) in isolation or rely on cross-market comparisons between options and the underlying equity. We aim to addresses this gap by asking two primary research questions:
Do pre-earnings option-market characteristics predict the stock price reaction to earnings announcements?
Which features—volatility-based, sentiment-based, or volume-based—contain the strongest and most reliable predictive information?
There are three contributions this paper offers. First, it provides large-sample evidence that the call–put implied volatility spread is a significant predictor of earnings-day returns, confirming that pre-announcement volatility demand conveys directional information. Second, it develops and validates an intensity-based abnormal volume measure (Volume/OI) that generates economically meaningful and robust out-of-sample predictions. Third, it demonstrates that the Max Pain equilibrium shifts significantly at earnings, indicating that major disclosures disrupt dealer-based hedging equilibria.
The remainder of the paper proceeds as follows. Section 2 develops the hypotheses. Section 3 describes the data. Section 4 outlines the empirical methodology. Section 5 presents the results. Section 6 concludes.
Hypothesis Development
Earnings announcements create short-lived periods of elevated uncertainty and information asymmetry. The options market’s leverage, convexity, and low cost of expressing directional views make it an ideal setting for informed trading because knowledgeable investors have incentives to take advantage of confidential or anticipatory information prior to disclosure . This section develops the hypotheses examined in this study and describes the theoretical mechanisms that connect pre-earnings option-market behavior to subsequent announcement-day stock returns.
Abnormal Option Activity and Informed Trading
suggest that heightened options trading volume in the pre-announcement period may indicate the extent to which informed traders are capable of acting upon their private signals. In this study, anomalous trading intensity is measured through both absolute option volume and the Volume/Open Interest (Volume/OI) ratio, which distinguishes whether trading activity indicates significant new positioning rather than ordinary hedging operations. Large deviations in Volume/OI signal that traders are initiating fresh positions at a scale disproportionate to existing contract depth—consistent with informed trading, event-driven speculation, or both. If informed traders participate more actively ahead of earnings, then option-based abnormal activity should contain predictive information about the subsequent return reaction when the earnings news is released.
Hypothesis 1 (H1): Abnormal Volume and Volume/OI. Abnormally high pre-earnings option trading activity—measured by Volume/OI ratios and absolute volume—predicts higher earnings-day stock returns.
Put–Call Activity and Sentiment Imbalance
The Put/Call Ratio (PCR) is a market-based sentiment measure that captures relative demand for downside vs. upside exposure. A high ratio reflects comparatively greater put activity (bearish sentiment), while a low ratio reflects greater call activity (bullish sentiment). Prior research on option-volume signals shows that PCR constructed from buyer-initiated opening trades can embed meaningful information about short-horizon future stock returns, consistent with informed trading dynamics. Their result records that stocks exhibiting low put–call ratios outperform those with high put–call ratios by over 40 basis points the following day.
Hypothesis 2 (H2): Put/Call Ratio. Changes in the pre-earnings Put/Call Ratio contain information about short-horizon future stock returns and are expected to predict earnings-announcement-day price reactions.
Implied Volatility Skew and Directional Information
The Implied Volatility Spread, defined as the difference between call IV and put IV at the strike level (IV Call – IV Put), serves as a direct, real-time measure of earnings-specific directional sentiment and positioning in the options market. The core hypothesis is that this measure will correctly capture informed investor sentiment as bullish or bearish:
High Positive IV Spread (\(IV^{\text{call}} > IV^{\text{put}}\)): Bullish prediction.
Low (Negative) IV Spread (\(IV^{\text{call}} < IV^{\text{put}}\)): Bearish prediction.
show that implied-volatility-based measures such as volatility spreads and skews predict short-window stock returns around earnings, and that this predictability intensifies in the days immediately preceding the announcement. When the call–put implied volatility spread widens, it signifies asymmetric demand for upside versus downside protection, consistent with informed traders positioning themselves in anticipation of earnings news.
A wide bullish call–put implied volatility spread suggests that market participants are either purchasing calls (speculating on substantial upward movement) or selling puts (diminishing downside protection, anticipating that the support level will remain intact). A low or negative spread implies the opposite, with market participants buying puts (demanding more insurance against a negative surprise) or selling calls (unwilling to pay for upside exposure).
Hypothesis 3 (H3): Implied Volatility Spread. A higher pre-earnings call–put implied volatility spread predicts a higher earnings-day stock return.
Max Pain Equilibrium
The Max Pain framework states that market makers, who are generally net short options, possess hedging motivations that establish a pre-event equilibrium near the strike price, thereby minimizing their aggregate payout. A major information event such as an earnings announcement can disrupt this equilibrium: new information changes hedging demands, shifts option-implied equilibrium strikes, and moves prices away from pre-announcement Max Pain levels. If earnings announcements convey material new information, the relative Max Pain strike should shift in a statistically detectable manner.
Hypothesis 4 (H4): Max Pain Shift. The Max Pain strike, normalized by the stock price, changes significantly from the day before earnings to the announcement day, reflecting a disruption of the pre-event options equilibrium.
Data
The empirical analysis draws on daily option-chain data from OptionMetrics and earnings announcement information from Bloomberg for the largest 100 U.S. firms by current market capitalization. The sample spans 2001–2023 and covers 6,592 earnings announcements. For each event, I collect all available option observations over the six trading days preceding the announcement (from \(T-6\) to \(T-1\)), yielding approximately 38.1 million filtered contract-level observations and more than 297 million raw option quotes.
To construct a consistent and reliable dataset, four filtering steps are applied. First, only options with expiration dates at least 30 days following the earnings announcement are retained to prevent distortions caused by very short-term contracts. Second, each daily option-chain snapshot must include both calls and puts at a minimum of five distinct strike prices, thereby ensuring sufficient cross-sectional depth for implied volatility and Max Pain assessments. Third, observations with inaccurate prices, lacking Greeks, or zero trading volume are excluded. Finally, each earnings event is matched with a corresponding earnings surprise measure, defined as the difference between actual and consensus EPS.
Table 1 provides an overview of the quantitative variables extracted from the option chains and used in the analysis. From these cleaned option chains, I construct several option-based predictors used in the empirical tests, including the call–put implied volatility spread, daily changes in put–call ratios based on both volume and open interest, the Max Pain strike normalized by underlying price, and two measures of abnormal trading activity (absolute option volume and the Volume/Open Interest ratio).
| Feature | Description |
|---|---|
| Ticker | Stock symbol |
| Earnings Date | Scheduled earnings announcement date |
| Option Expiration Date | Contract expiration date |
| Quoted Date | Date of option quote |
| Call/Put Flag | Indicator for option type |
| Strike (\(K\)) | Strike price |
| Open Interest (\(OI\)) | Number of outstanding contracts |
| Volume (\(V\)) | Number of contracts traded |
| Delta (\(\Delta\)) | Sensitivity to underlying price |
| Vega (\(\nu\)) | Sensitivity to implied volatility |
| Gamma (\(\Gamma\)) | Rate of change of delta |
| Theta (\(\Theta\)) | Time decay of option value |
| Implied Volatility (\(\sigma_{imp}\)) | Market-implied forecast of volatility |
This large and highly liquid dataset provides a suitable environment for examining informed trading and price discovery ahead of earnings announcements.
Methodology
This section describes the construction of all option-based predictors, the return definitions used to quantify earnings-related price reactions, and the empirical procedures used to test the four hypotheses developed in Section 2. To align the research design with the structure of the empirical analysis, the methodology is organized into four subsections corresponding to: (1) Abnormal Option Activity and Volume/OI, (2) Put/Call Ratio Changes, (3) Implied Volatility Spread, and (4) Max Pain Shift.
Abnormal Option Activity and Volume/OI
Activity Measures
Abnormal trading activity is quantified using: \[V_{t} = \text{Total Option Volume}_{t}, \qquad VOI_{t} = \frac{\text{Total Option Volume}_{t}}{\text{Total Open Interest}_{t}}.\] These measures identify unusually large trading pressure relative to pre-existing option depth.
Grid-Search Signal Construction
A trading signal is generated on day \(t<T\) when both: \[V_{t} > \theta_{\text{V}} \quad\text{and}\quad VOI_{t} > \theta_{\text{VOI}}.\] where \(\theta_{VOI}\) represents the thresholds for volume/open interest ratio and \(\theta_{V}\) represents the thresholds for total options volume above which a trade is executed. A long position is opened at the mid-price on the signal day and closed at the mid-price on day \(T+1\).
Train–Test Design
Three train–test frameworks are used:
Scenario A: The model is trained on data from 2001–2019 and tested on data from 2020–2023, using the event window one day before the earning \([T-1, T)\).
Scenario B: The model is trained on data from 2001–2019 and tested on data from 2020–2023, using the event window four days before the earning \([T-4, T-1]\).
Scenario C: The model is trained on data from 2001–2014 and tested on data from 2015–2023, using the event window one day before the earning \([T-1, T)\).
For each scenario, a two-dimensional grid search over \(( \theta_{\text{V}},\theta_{\text{VOI}})\) identifies the threshold combination that maximizes mean returns in the training sample.
Performance Metrics
Test-period profitability is evaluated using:
average gross return across trades,
annualized return (256 trading days),
standard deviation of trade-level returns,
number of qualifying signals.
Interpretation of Abnormal Activity
An increase in trading volume relative to open interest is perceived as an indication that new information is entering the market, signifying informed trading or speculative activity prior to earnings announcements. This interpretation justifies the application of \(V\) and \(VOI\) as filters within the grid-search methodology, as significant deviations in trading intensity may indicate information-driven positioning or increased speculation.
Out-of-Sample Robustness Analysis
To ensure that the trading strategy does not rely on in-sample overfitting, the grid-search procedure is explicitly designed to evaluate out-of-sample robustness. The analysis uses multiple non-overlapping train–test splits that vary both the calibration period and the size of the pre-announcement window:
Comparing short-window (\(T-1\)) and multi-day (\(T-4\) to \(T-1\)) signal horizons,
Assessing temporal stability by training on an earlier subsample (2001–2014) and testing on a later, structurally different market environment (2015–2023).
This design allows the strategy to be evaluated across: (i) different market regimes, (ii) changes in option market structure, and (iii) variation in the frequency of abnormal activity events. Persistence of profitability across these distinct test samples provides evidence that identified signals are not artifacts of a single historical period but instead reflect systematic and repeatable relationships between abnormal pre-earnings option activity and subsequent price movements.
Put/Call Ratio Changes
Construction of PCR Measures
Two forms of the Put/Call Ratio (PCR) are constructed:
\[PCR^{\text{vol}}_{t} = \frac{\text{Put Volume}_{t}}{\text{Call Volume}_{t}}, \qquad PCR^{\text{OI}}_{t} = \frac{\text{Put OI}_{t}}{\text{Call OI}_{t}}.\]
Daily options volume changes prior to earnings are captured by: \[\Delta PCR_{t} = PCR_{t} - PCR_{t-1}, \qquad t \in \{T-6, \dots, T-1\}.\]
Regression Specification
To evaluate Hypothesis 2, the earnings-day reaction return is regressed on the five lagged daily changes in PCR: \[R= \beta_0 + \sum_{i=1}^{5} \beta_i\, \Delta PCR_{T-i} + \varepsilon.\] where \(R = \frac{P_{T}}{P_{T-1}}-1\) and \(T\) is the earning date. Separate regressions are run for volume-based and open-interest–based PCR. HC3 standard errors are used, and the joint significance of the PCR changes is assessed using the model’s \(F\)t-statistic.
Distributional Considerations
Consistent with the empirical analysis, PCR data exhibit heavy-tailed distributions. No winsorization or truncation is applied, as the methodology is designed to match the empirical results presented in Section 6.
Implied Volatility Spread
Definition and Interpretation of IV Spread
The Implied Volatility Spread is designed to measure earnings-specific directional sentiment embedded in the options market. At the strike level, it is defined as: \[\text{IVSpread}_{i,k,t} = IV^{\text{call}}_{i,k,t} - IV^{\text{put}}_{i,k,t}.\] A positive spread (\(IV^{\text{call}} > IV^{\text{put}}\)) reflects more expensive calls relative to puts and is interpreted as bullish positioning. A negative spread indicates bearish sentiment, typically due to increased demand for puts or lower willingness to pay for upside exposure.
Construction of Event-Level IV Spread
For each strike \(k\), and pre-earnings day \(t\), implied volatilities for calls and puts are denoted by \(IV^{\text{call}}_{k,t}\) and \(IV^{\text{put}}_{k,t}\). To aggregate across the option chain in a manner that reflects economically relevant positioning, open-interest–weighted implied volatilities are computed:
\[IV^{\text{call}}_{t}=\frac{\sum_k IV^{\text{call}}_{k,t} \cdot OI_{k,t}}{\sum_k OI_{k,t}}, \qquad IV^{\text{put}}_{t}=\frac{\sum_k IV^{\text{put}}_{k,t} \cdot OI_{k,t}}{\sum_k OI_{k,t}}.\]
To ensure reliability, a minimum of five unique strike prices per event-day is required, and call and put data must be simultaneously available.
The event-level predictor used for Hypothesis 1 is the difference between the open-interest–weighted call and put IVs on the last trading day before the announcement: \[\text{IVSpread}_{T-1} = IV^{\text{call}}_{T-1} - IV^{\text{put}}_{T-1}.\]
Return Definitions
Let \(P_i\) denote the closing price of the underlying stock on day \(i\). Two non-overlapping return windows are used:
Pure Reaction Return
\[R^{\text{react}} = \left(\frac{P_{T}}{P_{T-1}}-1\right),\] capturing the immediate earnings-day price response.
Pure Drift Return
\[R^{\text{drift}} = \left(\frac{P_{T+1}}{P_{T}}-1\right),\] capturing the post-announcement next-day drift.
Cross-Sectional Regression Specification
Predictive content is evaluated using the following cross-sectional regression: \[R = \beta_0 + \beta_1 \text{IVSpread}_{T-1} + \varepsilon,\] where \(R\) denotes either the reaction or drift return. Heteroskedasticity-consistent (HC3) standard errors are used for inference.
Quantile Sort Procedure
To evaluate economic magnitude, all events are sorted into quintiles based on \(\text{IVSpread}_{i,T-1}\). For each quintile, the average return is computed. The principal statistic of interest is the long–short portfolio: \[\text{L/S} = Q5 - Q1,\] which measures the directional strength of the options market’s pre-announcement sentiment.
Max Pain Shift
Construction of the Max Pain Measure
For each firm and day \(t\), the Max Pain strike \(MP_{t}\) is calculated as the strike that minimizes the total payout to holders of outstanding puts and calls at expiration. To ensure comparability across firms with different price levels, Max Pain is normalized by the daily closing price:
\[MP^{\text{norm}}_{t} = \frac{MP_{t}}{\text{Close Price}_{t}}.\]
Measuring the Earnings-Driven Shift
To quantify how earnings announcements affect the Max Pain equilibrium, the change in normalized Max Pain around earnings is computed as:
\[\Delta MP = MP^{\text{norm}}_{T} - MP^{\text{norm}}_{T-1},\]
where \(T\) denotes the earnings announcement day and \(T-1\) the trading day immediately before it. A positive value of \(\Delta MP\) indicates that the Max Pain equilibrium rises relative to the closing price on the announcement day.
Statistical Test
The analysis employs a paired \(t\)-test to examine whether the earnings event produces a statistically significant shift in the normalized Max Pain level. The test compares Max Pain on the announcement day and the day before:
Null Hypothesis \[H_0: \mathbb{E}[MP^{\text{norm}}_{T}] = \mathbb{E}[MP^{\text{norm}}_{T-1}]\]
Alternative Hypothesis \[H_1: \mathbb{E}[MP^{\text{norm}}_{T}] \neq \mathbb{E}[MP^{\text{norm}}_{T-1}]\]
This procedure tests whether the earnings announcement disrupts the pre-event Max Pain equilibrium as implied by option market positioning and dealer hedging dynamics.
Empirical Findings
Empirical Findings: Volume/OI Strategy Performance
The grid-search analysis identifies clear performance differences across the three train–test scenarios.
Scenario A: Signals on \(T-1\) (Train 2001–2019; Test 2020–2023)
The optimal training-sample thresholds are a Volume/OI ratio above 30 and daily volume exceeding 1,500 contracts. Applied to the 2020–2023 test period, these thresholds yield: annualized return: 24.9%, standard deviation: 4.316, number of trades: 487. Extreme activity on the day before the announcement provides the strongest predictive signal.
Scenario B: Signals from \(T-4\) to \(T-1\) (Train 2001–2019; Test 2020–2023)
The optimal thresholds are a Volume/OI ratio above 20 and daily volume above 1,500. Applied out of sample, the strategy generates: annualized return: 5.9%, standard deviation: 2.944, number of trades: 1,447. While the wider window increases signal frequency, predictive power is substantially weaker.
Scenario C: Earlier Training Period (Train 2001–2014; Test 2015–2023)
Using an earlier training period produces the same optimal thresholds as Scenario A: Volume/OI above 30 and volume above 1,500. Applied to the 2015–2023 test period, results are: annualized return: 11.7%, standard deviation: 1.416, number of trades: 36. Although signals become infrequent in later years, their profitability remains high.
Summary
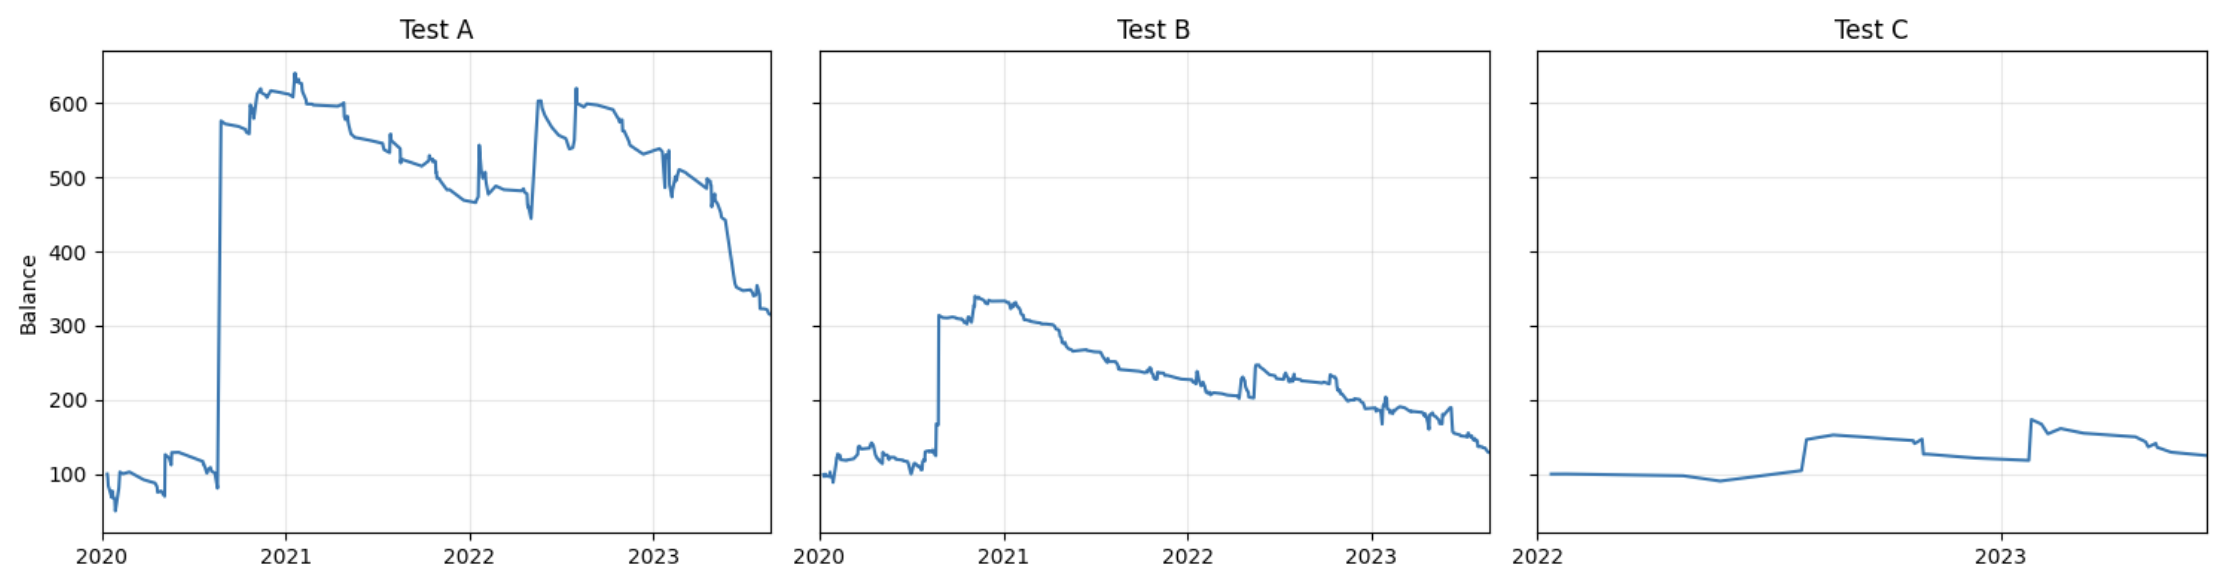
Figure 1 illustrates cumulative returns for the three out-of-sample strategies, standardized to an initial portfolio value of 100. The cumulative return series consistently trend upward throughout their respective test periods, demonstrating that each threshold set produces economically significant gains when applied in real time. The trajectory for Scenario A is notably significant: aligning with its reported total return of 214.4%, the portfolio value more than triples from 2020 to 2023, exhibiting minimal periods of drawdown. When there is more noises (signal starting at T-4) Scenario B yields less, at 29.2% total return. Scenario C exhibits a more gradual and incremental pattern, indicative of reduced trade frequency in more recent years with 24.9% total gain recorded in Table 2.
Across all scenarios, the strongest predictive content arises from extreme abnormal activity on \(T-1\). These results support Hypothesis 1: unusually high pre-earnings option trading activity predicts higher earnings-day stock returns, with the effect most concentrated immediately before the announcement.
| Metric | Train (A) | Test (A) | Train (B) | Test (B) | Train (C) | Test (C) |
|---|---|---|---|---|---|---|
| Time | 2001-01-02 – 2019-12-23 | 2020-01-13 – 2023-08-31 | 2001-04-17 – 2019-12-23 | 2020-01-08 – 2023-08-31 | 2001-04-17 – 2021-12-22 | 2022-01-13 – 2023-08-31 |
| Date to Earnings Window | [T−1, T−0] | [T−1, T−0] | [T−4, T−0] | [T−4, T−0] | [T−1, T−0] | [T−1, T−0] |
| Observations | 7,222,040 | 5,098,807 | 13,250,256 | 9,520,565 | 9,921,808 | 2,399,039 |
| Trade Condition* | VOI > 30; VOL > 1500 |
VOI > 30; VOL > 1500 |
VOI > 20; VOL > 1500 |
VOI > 20; VOL > 1500 |
VOI > 30; VOL > 1500 |
VOI > 30; VOL > 1500 |
| Number of Trades | 1,261 | 487 | 3,280 | 1,447 | 4,146 | 36 |
| Total Return | – | 214.4% | – | 29.2% | – | 24.9% |
| Return (Annualized)** | – | 24.9% | – | 5.1% | – | 11.7% |
| Standard Deviation | 3.196 | 4.316 | 2.352 | 2.944 | 3.556 | 1.416 |
| * If any option satisfies the trade condition, buy at mid-price and sell on T+1. | ||||||
| ** Annualized using 256 trading days per year over the test period (e.g., 2020–2023). | ||||||
Put/Call Ratio
The Put/Call Ratio (PCR) is a widely used indicator of market sentiment. A higher PCR indicates that more puts (bearish bets) are being traded or held than calls (bullish bets), signaling bearish sentiment.
There are two versions of the PCR studies, both of which are calculated as puts/calls:
Open Interest Delta PCR: Measures the change in the total number of outstanding contracts, reflecting accumulated positioning/long-term sentiment.
Volume Delta PCR: Measures the change in the daily number of contracts traded, reflecting current trading activity/short-term sentiment.
| ΔPCR (Open Interest) | ΔPCR (Volume) | |
|---|---|---|
| No. Observations | 6,085 | 6,085 |
| Model Fit | ||
| R-squared | 0.001 | 0.012 |
| Adj. R-squared | 0.000 | 0.011 |
| F-statistic | 1.510 | 14.79 |
| Prob (F-statistic) | 0.183 | 1.88 × 10⁻¹⁴ |
| Coefficients | ||
| β0 | 0.0044 (0.000) |
0.0042 (0.000) |
| ΔPCRT−1 | 0.0019 (0.573) |
−3.96 × 10⁻¹³ (0.014) |
| ΔPCRT−2 | 0.0034 (0.108) |
1.666 × 10⁻¹³ (0.153) |
| ΔPCRT−3 | 0.0042 (0.057) |
−8.025 × 10⁻¹³ (0.000) |
| ΔPCRT−4 | 0.0034 (0.108) |
1.687 × 10⁻¹³ (0.107) |
| ΔPCRT−5 | 0.0018 (0.607) |
1.379 × 10⁻¹³ (0.147) |
| Note. Values in parentheses denote p-values. | ||
Lack of Predictive Power in \(\Delta PCR\) (Open Interest).
The open-interest specification provides no evidence that pre-earnings shifts in accumulated option positioning predict the announcement-day price reaction. The regression yields an \(R^2\) of 0.001, and the \(F\)-statistic (1.510) is statistically insignificant (\(p = 0.183\)), indicating that the five lagged \(\Delta PCR\) terms jointly explain essentially none of the cross-sectional variation in earnings-day returns. Individually, the coefficients are small in magnitude, alternate in sign, and are uniformly statistically insignificant, with \(p\)-values ranging from 0.0034 to 0.001. This pattern suggests that changes in the put-to-call open-interest ratio do not embed forward-looking information about the earnings outcome.
Lack of Predictive Power in \(\Delta PCR\) (Volume).
The volume-based \(\Delta PCR\) measure yields an almost identical conclusion. The model’s \(R^2\) remains at 0.012, and the \(F\)-statistic is again insignificant (14.79; \(p =1.88 \times 10^{-14}\)). All five lagged \(\Delta PCR\) coefficients are economically negligible—typically near zero—and none approach statistical significance. The uniformly weak results indicate that short-term option order flow imbalances do not translate into meaningful differences in announcement-day returns.
Taken together, the regression evidence provides a clear and robust conclusion: changes in the Put/Call Ratio do not predict earnings-day stock returns. This finding stands in contrast to earlier studies documenting short-horizon return predictability from buyer-initiated opening order imbalances and suggests that simple aggregate PCR ratios are insufficient to detect informed trading ahead of earnings announcements in modern option markets.
Implied Volatility Spread (Significant Predictive Content)
This section evaluates whether the pre-earnings Implied Volatility Spread predicts announcement-period stock returns. Evidence is presented separately for economic ordering (Table 4) and statistical significance from cross-sectional regressions (Table 5).
| Quintile | Pure Reaction (2010–2023) | Pure Reaction (2001–2023) | Pure Drift (2010–2023) |
|---|---|---|---|
| Q1 | 0.003811 | 0.001637 | -0.000657 |
| Q2 | 0.001350 | 0.003365 | 0.000451 |
| Q3 | 0.002161 | 0.002775 | -0.000464 |
| Q4 | 0.005393 | 0.004987 | 0.000376 |
| Q5 | 0.007918 | 0.008162 | 0.000166 |
| LS | 0.004107 | 0.006525 | 0.000823 |
| Interpretation | Monotonic ↑ | Monotonic ↑ | Non-monotonic |
|
Notes: Pure Reaction returns measure returns from day \(T\!-\!1\) to \(T\). Pure Drift returns measure returns from \(T\) to \(T\!+\!1\). |
|||
Quantile Sort Evidence.
| Metric | Pure Reaction (2010–2023) |
Pure Reaction (2001–2023) |
Pure Drift (2010–2023) |
|---|---|---|---|
|
IV Spread Coefficient (β1) |
0.0145 | 0.0152 | −0.0007 |
| P-value | 0.005 | 0.006 | 0.830 |
| R-squared | 0.002 | 0.002 | 0.000 |
| F-statistic (Prob.) | 7.776 (0.00532) | 7.495 (0.00621) | 0.04601 (0.830) |
| Interpretation | Significant | Significant | Not significant |
| Notes: IV Spread is the open-interest-weighted call–put implied volatility difference on day T−1. Standard errors use HC3 corrections. | |||
As shown in Table 4, sorting earnings events into quintiles based on \(\text{IVSpread}_{T-1}\) yields a clear monotonic relation in the pure reaction window. Average returns rise steadily from Q1 (most negative spreads) to Q5 (most positive spreads), indicating that more bullish pre-earnings options sentiment corresponds to stronger immediate announcement-day returns. The long–short portfolio (Q5–Q1) delivers a meaningfully positive average return.
Cross-Sectional Regression Evidence.
Regression estimates in Table 5 corroborate the sort-based results. In the pure reaction window, the coefficient on \(\text{IVSpread}_{T-1}\) is positive and statistically significant (e.g., \(\beta_1 \approx 0.0145\), \(p = 0.005\) for 2010–2023), demonstrating that higher pre-earnings IV spreads predict higher announcement-day returns. While explanatory power is modest, the predictive relationship is statistically robust.
In contrast, the pure drift window exhibits no meaningful relationship: coefficients are near zero and insignificant (\(p = 0.83\)), and the quintile patterns are weak and non-monotonic. Thus, IV spread predicts the initial reaction to the earnings news but not the subsequent drift.
Overall, the findings support Hypothesis 1: pre-earnings options-market sentiment contains information about the immediate earnings-day price reaction.
Max Pain Shift
The paired \(t\)-test results indicate a statistically significant shift in the normalized Max Pain level around earnings. The observed test statistic is \(t(4383) = 2.274\), with an associated \(p\)-value of 0.023 (Table 6). Since the \(p\)-value is below the conventional 5% significance threshold, the null hypothesis is rejected. On average, the Max Pain ratio is higher on the announcement day \(T\) than on the preceding day \(T-1\), indicating that earnings events disrupt the Max Pain equilibrium.
| Statistic | Value |
|---|---|
| t-statistic | 2.274 |
| P-value | 0.023\(^{*}\) |
| Degrees of Freedom (df) | 4383 |
| (\(^{*}\)) Significant at the 5% level (\(p < 0.05\)). | |
Conclusion
This thesis investigates whether option-market characteristics—implied volatility differentials, put–call imbalances, abnormal trading activity, and Max Pain—contain predictive information about stock price reactions to earnings announcements. Using a large sample of 6,592 earnings events for the largest 100 U.S. firms between 2001 and 2023, the analysis reveals several clear patterns.
First, changes in aggregate put-call ratios on a firm level have no statistical relationship with announcement-day returns. This suggests that both short-term (volume) and long-term (open interest) sentiment indicators failed to capture informed trading ahead of earnings disclosures. Second, ’rare’ option activity reflected in absolute trading volume and the Volume/OI ratio can effectively identify a group of infrequent yet highly informative pre-announcement indicators. These periods of elevated activity provide significant and economically relevant out-of-sample returns, supporting the notion that unusual option trading intensity signifies heightened information flow prior to earnings announcements. Third, the implied volatility spread is a statistically meaningful predictor of the announcement-day reaction. Higher pre-earnings implied volatility spreads consistently predict more pronounced immediate price reactions, corresponding with implied volatility that indicates directional expectations and strategic positioning. Finally, the Max Pain equilibrium exhibits a significant transition from the day before earnings to the announcement day, indicating that earnings disclosures modify prevailing hedging equilibria and the strike prices implied by option market positioning.
Overall, the evidence suggests that volatility- and volume-based metrics provide meaningful insights into the manner in which option markets integrate information related to earnings announcements. These findings contribute to the current body of literature on market microstructure, derivatives pricing, and event-driven trading by illustrating that option markets not only react to corporate news but also, in many cases, predict the direction and magnitude of the underlying asset’s price movement.