When the Government Closes: Economic Responses to Federal Shutdowns
Carnegie Mellon University in QatarIntroduction
The 2025 U.S. government shutdown was the longest on record, enduring for 43 days. The shutdown is projected to have incurred an economic cost of up to $14 billion weekly (Morgan, 2025). In the 2013 shutdown, 800,000 federal employees were furloughed, compensation for 1.3 million workers was deferred, and GDP growth decelerated by 0.1–0.2%. The reduction in GDP surpassed the costs related to maintaining government operations (The Economist, 2013).
Despite the scale of these disruptions, relatively little is known about how high-frequency indicators of real economic activity in the immediate aftermath of shutdown events—especially indicators like the Weekly Economic Index (WEI), which reflects real-time variations in U.S. economic conditions. Instances of political deadlock in the United States, especially government shutdowns, have attracted increased attention from policymakers, investors, and economists. These events denote intervals of considerable fiscal instability, marked by temporary interruptions in government activities, delayed federal disbursements, and heightened concerns within the labour market. Understanding the short-term economic consequences of shutdowns is crucial for assessing their true macroeconomic impact and the risks posed by escalating political deadlocks.
Research Question
Do U.S. government shutdowns induce an immediate and quantifiable impact on overall economic activity, as evidenced by the Weekly Economic Index (WEI)?
Literature Review
Existing research on U.S. government shutdowns shows significant organisational and macroeconomic disturbances. The Congressional Budget Office determines that extended shutdowns diminish quarterly GDP growth and result in lasting output losses due to deferred expenditures and diminished consumer activity. Research conducted by Baker and Yannelis (2015) analyzes transactional-level financial data from the 2013 shutdown and shows that affected federal employees reduced their daily consumption by 10–15%, underscoring the direct impact of income uncertainty on household behavior. More recent research by Resh et al. (2025) employs a Difference-in-Differences methodology to compare furloughed and funded agencies during the 2018–2019 shutdown, finding significantly higher employee separations among less-tenured and non-permanent staff. Their study demonstrates how shutdowns strain federal organizations and highlights the value of causal identification strategies.
Table 1 summarizes all major federal government shutdowns since 1980. Democratic and Republican administrations have had single-day shutdowns to the 43-day 2025 shutdown. This historical variation shows that shutdowns are recurring fiscal events that create multiple quasi-experimental episodes for empirical analysis.
| Shutdown | Days | President | Party |
|---|---|---|---|
| 1976 Funding Gap (Sept 30 - Oct 11) | 10 | Gerald Ford | Republican |
| 1977 Funding Gap (Sept 30 - Oct 1) | 1 | Jimmy Carter | Democratic |
| 1977 Funding Gap (Oct 31 – Nov 9) | 8 | Jimmy Carter | Democratic |
| 1977 Funding Gap (Nov 30 – Dec 9) | 9 | Jimmy Carter | Democratic |
| 1978 Funding Gap (Sep 30 – Oct 18) | 18 | Jimmy Carter | Democratic |
| 1979 Funding Gap (Sept 30 - Oct 12) | 12 | Jimmy Carter | Democratic |
| 1980 Shutdown | 1 | Jimmy Carter | Democratic |
| 1981 Shutdown (Nov 20-22) | 2 | Ronald Reagan | Republican |
| 1982 Shutdown (Sept 30 - Oct 2) | 1 | Ronald Reagan | Republican |
| 1982 Shutdown (Dec 17 - 21) | 3 | Ronald Reagan | Republican |
| 1983 Shutdown (Nov 10 - 14) | 3 | Ronald Reagan | Republican |
| 1984 Shutdown (Sep 30 - Oct 3) | 2 | Ronald Reagan | Republican |
| 1984 Shutdown (Oct 3 - 5) | 1 | Ronald Reagan | Republican |
| 1986 Shutdown (Oct 16 - 17) | 1 | Ronald Reagan | Republican |
| 1987 Shutdown (Dec 18 - 20) | 1 | Ronald Reagan | Republican |
| 1990 Shutdown (Oct 5 - 9) | 3 | George H. W. Bush | Republican |
| 1995 Shutdown (Nov 14 - 19) | 5 | Bill Clinton | Democratic |
| 1995–96 Shutdown (Dec 16 - Jan 6) | 21 | Bill Clinton | Democratic |
| 2013 Shutdown (Oct 1 - 16) | 16 | Barack Obama | Democratic |
| 2018 Shutdown (Jan 20 - 22) | 3 | Donald Trump | Republican |
| 2018 Shutdown (Feb 9) | 1 | Donald Trump | Republican |
| 2018–2019 Shutdown | 35 | Donald Trump | Republican |
| 2023 Near-Shutdown | 0 days (averted) | Joe Biden | Democratic |
| 2025 Shutdown | 43 days | Donald Trump | Republican |
Research Gap and Contribution
Although previous studies have examined the administrative, organisational, and macroeconomic impacts of federal shutdowns, considerably less is understood about their weekly economic effects. Existing research generally relies on quarterly output indicators or administrative data, which are either too infrequent or directly influenced during shutdown periods. Thus, the current literature lacks conclusive evidence concerning the immediate impact of shutdowns on real economic activity.
This study contributes to the literature by utilising an event-study methodology that leverages the abrupt timing and recurring occurrence of shutdown episodes. Instead of comparing shutdown years to non-shutdown years within a difference-in-difference framework, the event-study methodology evaluates the temporal variations in the WEI during the weeks before and after each shutdown, relative to the week immediately preceding the shutdown. This framework is useful for capturing short-term effects in the absence of a clean, untreated control group.
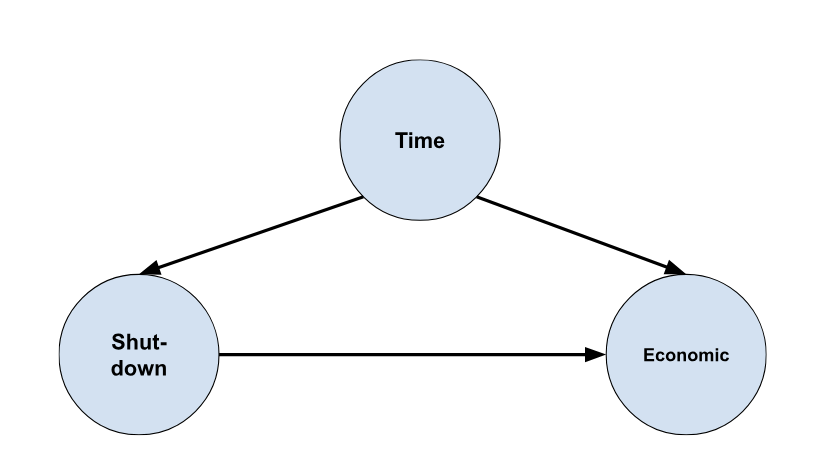
Figure 1 presents the causal pathway motivating this approach. Shutdowns are discrete policy shocks that directly affect real economic activity, while seasonality, business-cycle conditions, and weekly reporting structures independently affect shutdown likelihood and economic context. The DAG emphasises that identification requires isolating WEI deviations from background temporal forces. The event-study specification blocks these confounding pathways by including week-of-year and year fixed effects, allowing the estimated coefficients to trace shutdown’s causal effect on near-term economic activity.
Data and Methodology
Data Sources
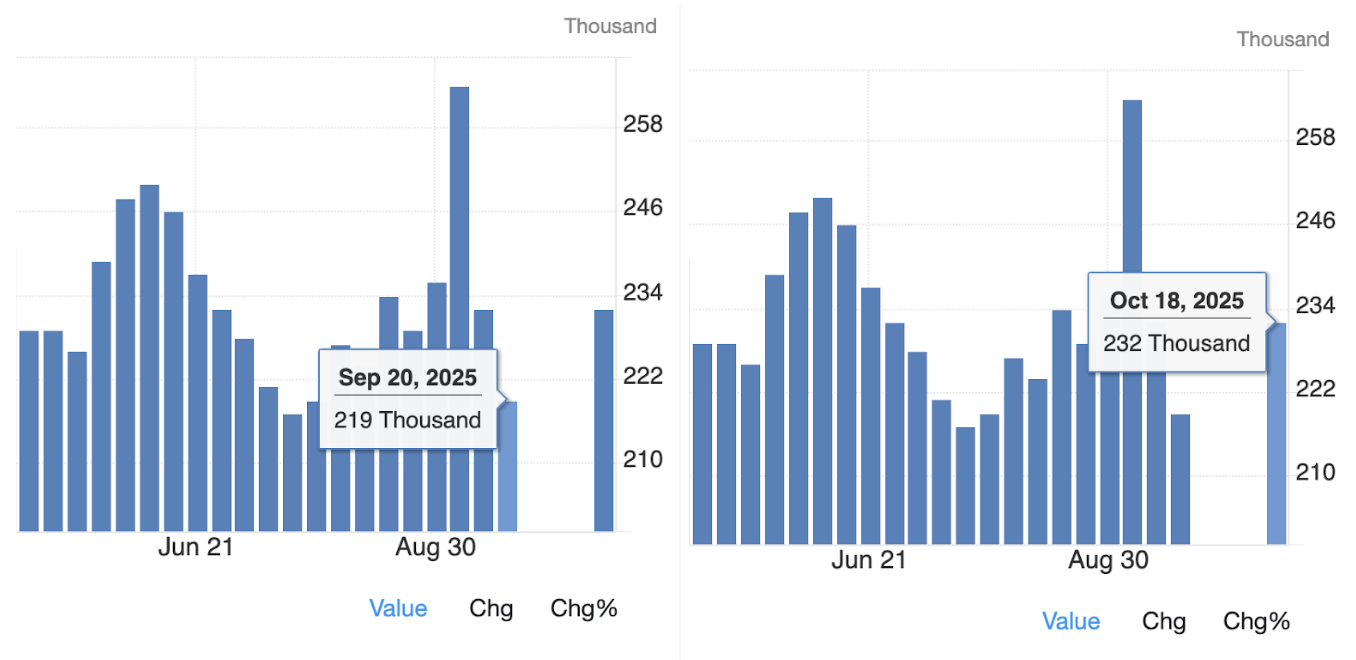
To study the impact of the government shutdown, it is best to use economic indicators that are driven solely by the shutdown. While it is the ideal condition to study using employment data, traditional weekly labor-market series—such as Initial Jobless Claims and Continued Unemployment Claims—were not consistently reported during the shutdown period, creating gaps in the available data. Figure 2 illustrates this issue by showing a missing interval in the Initial Jobless Claims series from September 20 to October 13. Because of this data discontinuity, the analysis instead relies on the Weekly Economic Index (WEI), which aggregates multiple real-time indicators and remains continuously available throughout the shutdown period.
The empirical analysis utilises publicly accessible daily and weekly data from the Federal Reserve Economic Data (FRED) database, spanning the years 2008 to 2025. The principal outcome variable is the Weekly Economic Index (WEI), a composite high-frequency metric created by economists at the Federal Reserve Bank of New York. The WEI consolidates ten weekly indicators, including consumer spending, labor market data, production, energy use, etc., to serve as a real-time proxy for U.S. real economic activity. The index is published weekly (concluding on Saturday) and is adjusted to allow interpretation akin to year-over-year real GDP growth; for instance, a WEI value of -2 indicates that real GDP is approximately 2 percentage points lower than in the corresponding week of the previous year.
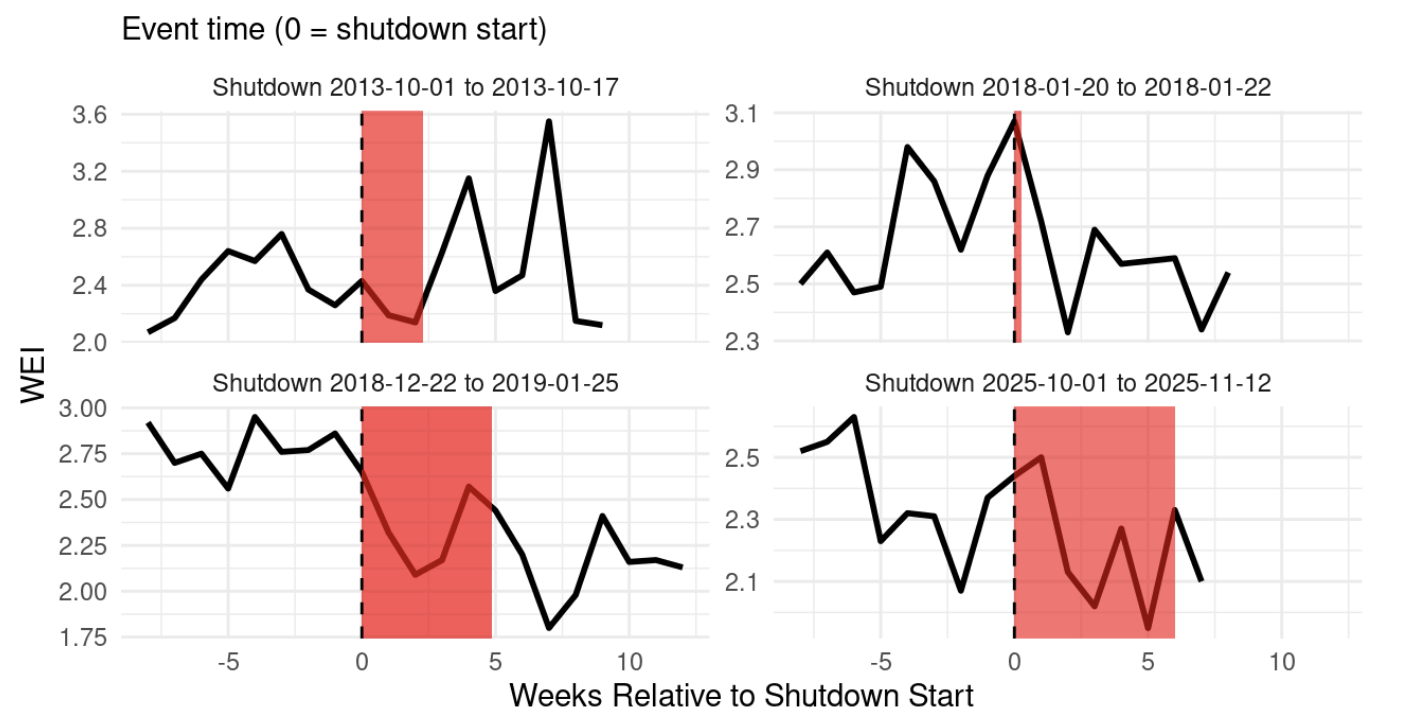
Figure 3 shows how the Weekly Economic Index behaves starting each shutdown episode before the event-study estimates. Each panel plots the WEI over a window around the shutdown start date, with the shaded region indicating federal operations were halted. In all episodes—2013, 2018, and 2025—the WEI drops immediately after the shutdown begins. Every episode shows a weekly economic activity decline after shutdown, though the magnitude varies. This pattern supports the study’s central hypothesis and motivates the event-study framework used to estimate shutdown dynamics.
Empirical Model and Identification Strategy
Shutdowns arise from political stalemates rather than deteriorating macroeconomic conditions, creating plausibly exogenous timing. Because they recur irregularly across years, they provide repeated quasi-experiments suitable for event-study analysis.
For each shutdown, a symmetric time window is constructed around the start date of the shutdown. Each week is assigned an event-time index relative to the week the shutdown begins, not the week the shutdown ends. Specifically:
event time = 0 denotes the week the shutdown starts.
event time \(<\) 0 represents the weeks before the shutdown begins.
event time \(>\) 0 represents the weeks after the shutdown has begun (i.e., weeks during the shutdown), not after the shutdown has ended.
Thus, event time \(>\) 0 captures the ongoing impact of a shutdown after it starts, not a post-shutdown recovery period.
The estimated model is: \[\label{eq:general_model} WEI_{t,e} = \alpha + \sum_{\tau \neq -1} \beta_{\tau}\,\mathbf{1}(event\_time_{t,e} = \tau) + \gamma_{\text{week}(t)} + \delta_{\text{year}(t)} + \varepsilon_{t,e}\] \[\begin{aligned} % \intertext{where the summation $\sum_{\tau \neq -1} \beta_{\tau}\,\mathbf{1}(event\_time_{t,e} = \tau)$ expands to:} WEI_{t,e} = \alpha & + \beta_{-8}\mathbf{1}(event\_time_{t,e} = -8) \\ & + \beta_{-7}\mathbf{1}(event\_time_{t,e} = -7) \\ & + \dots \\ & + \beta_{-2}\mathbf{1}(event\_time_{t,e} = -2) \\ & + \beta_{0}\mathbf{1}(event\_time_{t,e} = 0) \\ & + \beta_{1}\mathbf{1}(event\_time_{t,e} = 1) \\ & + \beta_{2}\mathbf{1}(event\_time_{t,e} = 2) \\ & + \beta_{3}\mathbf{1}(event\_time_{t,e} = 3) \\ & + \text{(additional event-time indicators)} \\ & + \gamma_{\text{week}(t)} \\ & + \delta_{\text{year}(t)} \\ & + \varepsilon_{t,e}\end{aligned}\] where \(t\) is time in weeks; \(e\) indexes shutdown events; \(\mathbf{1}(event\ time_{t,e}=\tau)\) equals 1 when week \(t\) is \(\tau\) weeks from the start of shutdown \(e\); \(event\_time=-1\) is the reference week, so each \(\beta_{\tau}\) measures the change in WEI relative to that week; \(\gamma_{\text{week}(t)}\) and \(\delta_{\text{year}(t)}\) are week and year fixed effects; \(\varepsilon_{t,e}\) is the error term.
Results and Discussion
The event-study results, presented in Table 2, show that U.S. government shutdowns generate an immediate decline in high-frequency economic activity once the shutdown begins. All pre-shutdown coefficients (event time = –8 to –2) are small and statistically insignificant (\(p\)-values \(>\) 0.17), providing no evidence of anticipatory declines before the shutdown starts.
| Estimate | Std. Error | p-value | |
|---|---|---|---|
| event_time = –8 | -0.5869 | 0.9317 | 0.5735 |
| event_time = –7 | -1.0647 | 1.0787 | 0.3964 |
| event_time = –6 | -0.9629 | 0.6883 | 0.2563 |
| event_time = –5 | -0.4093 | 0.3388 | 0.3135 |
| event_time = –4 | -0.3097 | 0.7069 | 0.6910 |
| event_time = –3 | -0.7425 | 0.5906 | 0.2977 |
| event_time = –2 | -0.5444 | 0.3086 | 0.1759 |
| event_time = 0 | -0.6003 | 0.3815 | 0.2137 |
| event_time = 1 | -1.2431 | 0.2864 | 0.0226* |
| event_time = 2 | -0.2857 | 0.1203 | 0.0981 |
| event_time = 3 | 0.0787 | 0.2151 | 0.7388 |
| event_time = 4 | -0.3116 | 0.1805 | 0.1827 |
| event_time = 5 | -0.7344 | 0.1483 | 0.0158* |
| event_time = 6 | 0.3730 | 0.1621 | 0.1049 |
| event_time = 7 | 0.4017 | 0.8099 | 0.6540 |
| event_time = 8 | -0.3787 | 0.2151 | 0.1766 |
| event_time = 9 | -0.2742 | 0.1247 | 0.1154 |
| event_time = 10 | 0.7317 | 0.3615 | 0.1361 |
| event_time = 11 | 1.0203 | 1.0219 | 0.3916 |
| Observations | 72 | ||
| Fixed Effects | Week (32), Year(5) | ||
| Clustered SEs | event_id | ||
| RMSE | 0.1752 | ||
| Within \(R^2\) | 0.2730 | ||
| Adj. \(R^2\) | -0.3106 | ||
| *Note: The omitted category is event time = −1 (the week immediately before the shutdown began). p-values marked with ∗ indicate statistical significance at the 5% level | |||
Consistent with the descriptive patterns shown earlier in Figure 3, the event-study coefficients confirm a significant decline in WEI in the first week after shutdown onset. Economic activity begins to weaken at event time = 0 (Estimate: \(-0.60\)), the week the shutdown starts, but the largest and clearest effect appears at event time = +1 (the first full week after the shutdown has begun). At this point, the WEI falls by approximately \(\mathbf{1.24}\) points (Estimate: \(-1.24\), \(p\)-value: 0.02) relative to the week immediately before the shutdown began. This estimate is statistically significant and economically meaningful. A 1.24-point drop in the WEI corresponds to roughly a \(1.2\%\) reduction in year-over-year GDP growth, or nearly $300 billion in real GDP growth quantity. In subsequent weeks (event time = 2 to 11), the WEI sees positive impacts (some coefficients \(>\) 0), but most are close to zero and statistically insignificant.
Conclusion and Limitations:
This study examines the immediate economic effects of U.S. government shutdowns using high-frequency data from the Weekly Economic Index and an event-study framework. The findings indicate a distinct and statistically significant reduction of 1.24 points in economic activity during the week following the commencement of a shutdown. When expressed in GDP-equivalent terms, this study signifies a substantial short-term contraction aligned with the disruptions recorded in previous instances.
It is imperative to recognize several limitations that may impact future research endeavors. Firstly, while government shutdowns have been occurring since 1976, the Weekly Economic Index (WEI) has only been accessible since 2008. This limitation restricts the analysis to more recent events and impedes the capacity for long-term comparisons across several decades. Furthermore, government shutdowns frequently coincide with broader political or fiscal instability, making it challenging to accurately differentiate the effects of shutdowns from concurrent political events. The infrequency of shutdowns, combined with their considerable range in duration, restricts statistical power and complicates the extrapolation of findings beyond the reported cases.
References
Baker, S. R., & Yannelis, C. (2015). Income Changes and Consumption: Evidence from the 2013 Federal Government Shutdown. SSRN Electronic Journal. https://doi.org/10.2139/ssrn.2575461
Morgan, D. (2025, October 29). Federal shutdown could cost US economy up to $14 billion. Reuters. https://www.reuters.com/sustainability/sustainable-finance-reporting/federal-shutdown-could-cost-us-economy-up-14-billion-2025-10-29/
Peter G. Peterson Foundation. (2023). A Brief History of U.S. Government Shutdowns and Why Other Countries Do Not Have Them. Retrieved from https://www.pgpf.org/article/a-brief-history-of-us-government-shutdowns-and-why-other-countries-do-not-have-them
Resh, W. G., Y. Ahn, W. Wang, and K. E. Lee. 2025. “ Employee Turnover Effects of the 2018–2019 United States Federal Government Shutdown.” Public Administration Review 1–15. https://doi.org/10.1111/puar.70032
The Economist. (2013, October 3). Closed until further notice: The shutdown is bad enough. What follows may be far worse. The Economist. https://www.economist.com/united-states/2013/10/03/closed-until-further-notice
Trading Economics. (n.d.). United States jobless claims. https://tradingeconomics.com/united-states/jobless-claims